Traditional analysis is good at answering “what a record is”, but weak at answering “who it relates to, where it passed through, and why it happened now”. Once a problem enters a complex network of relationships, the limits of the table appear.
Blind spots of linear data
In fund, case, audit and risk scenarios, data is inherently multi-source, heterogeneous and fragmented. One subject may appear across different systems, and a single transaction may link accounts, organizations, devices, locations and time. Tables break this into rows — easy to store, but hard to understand as a whole.
Analysts usually filter, compare and jump across many tables, then reconstruct the relationships in their head from experience. It is slow, and key leads easily drown in detail.
Let relationships take the lead
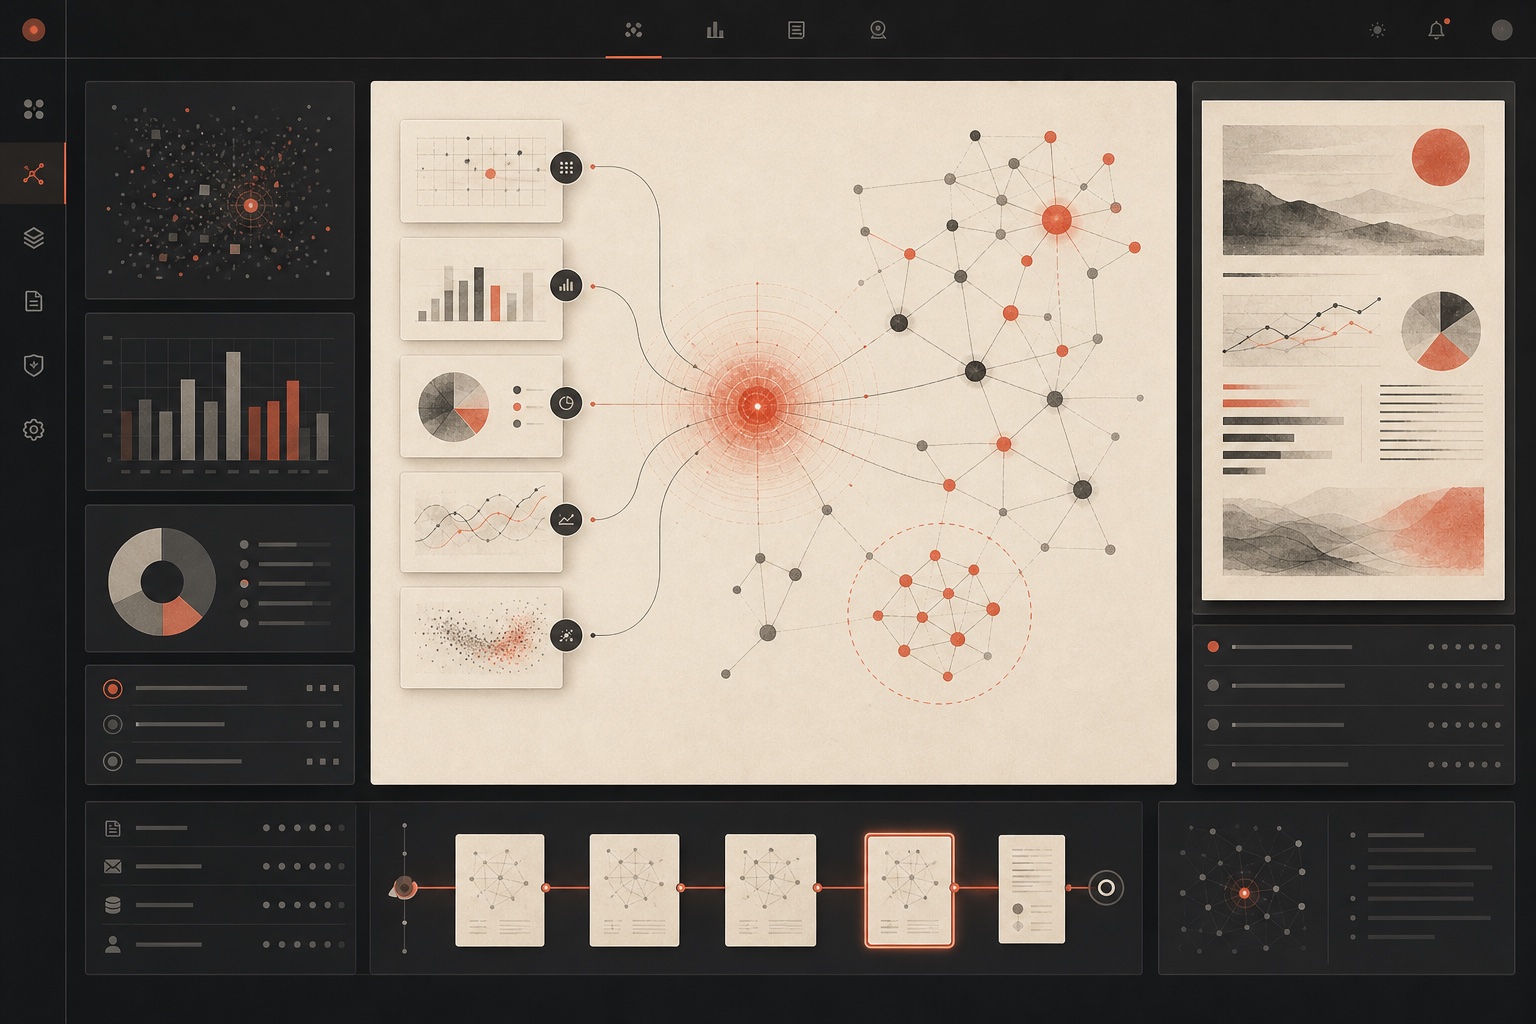
A knowledge graph reorganizes data with entities, relationships and attributes. People, accounts, organizations and events become nodes; transactions, holdings, communication and co-occurrence become links. Analysts no longer read single records — they observe paths, clusters, anomalies and change across the whole structure.
K2's value goes beyond “drawing the graph”. Through relation expansion, path analysis, business tagging, graph algorithms and multi-view visualization, users follow a lead and keep questioning, return to original records to verify, and distill expertise into reusable methods.
From data to insight is one continuous path
K2 BOX ingests and cleanses multi-source data, unifies standards, and builds a reliable data and graph foundation.
K2 uses interactive graphs, multi-view layouts and graph algorithms to locate key relationships and abnormal structures.
K2 AI understands natural-language instructions, calls underlying tools and returns verifiable results.
Turn the analysis process, domain tactics and final reports into knowledge the team can reuse.
The ultimate goal is to see the key lead sooner
Visualization is not the endpoint. For frontline investigation, what matters is narrowing the scope faster, understanding the evidence chain more clearly, and deciding the next step with more grounding. K2 closes the loop between data, algorithms and human judgment, turning repetitive search into a continuous, intuitive, traceable process.
When complex relationships become visible, experience no longer lives only in one person's head, and data is no longer just static records. Together they become intelligence that supports judgment.